Results
1. Discharge Rate
(1) Base Flow Rate

|
As shown in the figure to the left, the base flow rate in Door Creek is about 0.10~0.20 cms from August to September, while the peak flow occurs in March due to snow melting.
|
(2) Discharge Rate
The flow rate values output from HEC-HMS and HydroCAD were comparable to each other. However, the rational method values were found to underestimate the flow rate because it is a method used for sub-watersheds less than 2000 acres. Most of the sub-basin areas delineated from SWAT model are around or larger than this threshold.
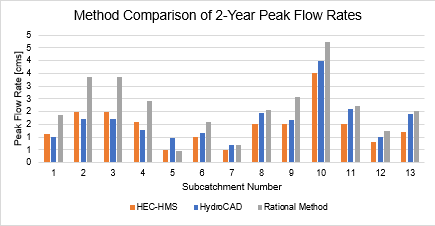
2-yr 24-hr Rainfall Event
|
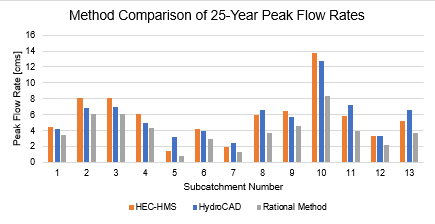
25-yr 24-hr Rainfall Event
|
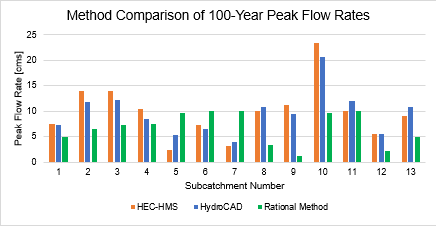
100-yr 24-hr Rainfall Event
|
USGS gauge near Highway MN records the flow rate in Door Creek every five minutes. We checked for the peak flow rate during Door Creek's August ~ September flooding event, the overall precipitation is 3.96 inches within 36 hours, and the peak recorded runoff flow rate is 7.316 cms. Since the location of USGS gauge is close to junction 6 in our model, and HEC-HMS model is able to output runoff hydrograph in each junction and reach, so we compared the peak flow rate in junction 6, which is 7.1 cms, with the real data, they match pretty well with about 3% bias. Hence, HEC-HMS model built by us can provide reliable input discharge data and we will use the simulation result for 2-yr, 25-yr and 100-yr 24-hr rainfall events as our input data sources for HEC-RAS model.
2. Water Profile
The following two water surface profiles generated from HEC-RAS are channel conditions for 2, 25 and 100-yr 24-hr flooding events in 1906 and 2014. Channel shape has experienced considerable changes in the downstream, however, the original meandering segment where we have marked as blue frame does not show many differences. By comparison, water depth in the upstream varies within the two years. There was a detention area in 1906 helps improve the water storage capacity in upstream and therefore reduced the water depth in the middle stream. This detention area was removed after several hydraulic constructions, so it is probably why the mid-stream water depth is increased from 0.3m to 0.8m.

3. Inundation Map
From the inundation map generated using ArcMap as well as HEC-RAS, the submerged area in Door Creek downstream looks very similar between 1906 and 2014. Nevertheless, in 2014 map, there would be more inundated area in the upstream if flooding occurs. Additionally, according to the flooding gif, the city of Cottage Grove would encounter waterlogging if a 50-yr or more rainfall event happens.

Inundation Map (1906) 2yr to 24yr Flood Event
|

Inundation Map (2014) 2yr to 24yr Flood Event
|
