Approaches
Approach 1 - Hydrological Model for Discharge Rate
Data on the Door Creek discharge rates is limited for building the HEC-RAS models, as there is only one USGS gauge located at Highway MN. Therefore the discharge rates were found using three different hydrologic methods: the SCS Unit Hydrograph, the travel time method, and the rational method.
HEC-HMS - SCS Unit Hydrograph Method HEC-HMS is one of HEC-series tools, which aids in calculating the discharge rate at an identified basin, reach, or junction using hydrological methods.
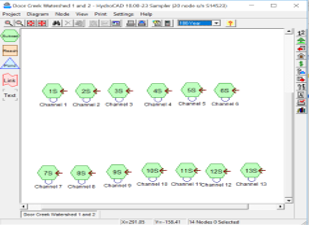
An assumed constant base flow and SCS precipitation distribution curve were used for the HEC-HMS model instead of the recession method because the basic soil and hydrologic information within the Door Creek Watershed was limited. The base flow data was obtained using the USGS gauge nearby Highway MN in Door Creek. The base flow value used for the model was found by averaging the monthly discharge rate prior to precipitation events at this location for data between 2016 and 2018. Thirteen sub-watershed units for each sub-basin and eleven reaches for the main channel or large branches were created within the HEC-HMS model. For simplicity, small junctions were omitted and eight main junctions were used as shown in the figure to the right. ArcMap provided the necessary watershed characteristics, such as slope and area. The meteorological data (precipitation and storm area) was gathered from NOAA. The flow rates found within each reach will be input into the HEC-RAS model. |


|

|
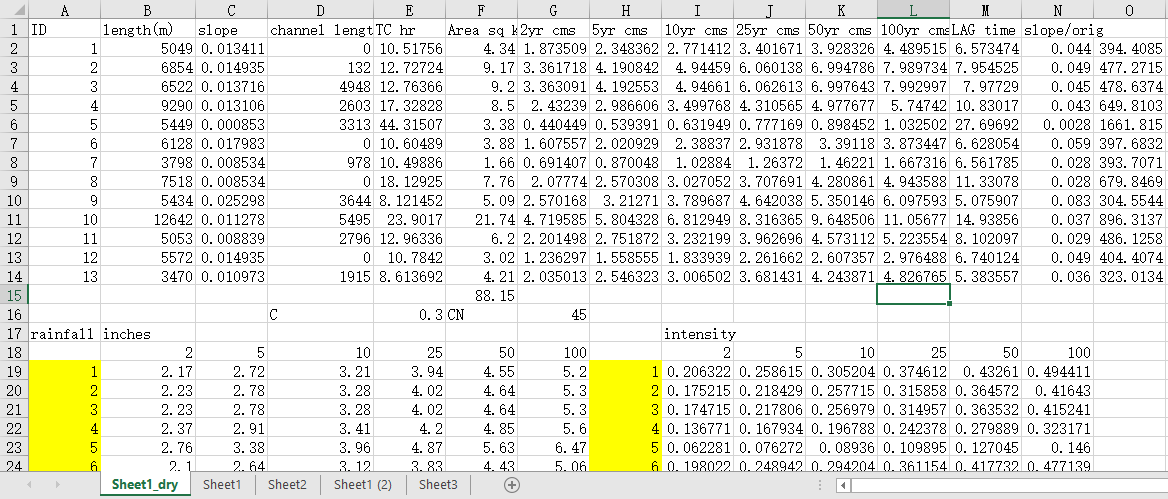
HydroCAD - Travel Time Method The discharge rate was also calculated using the Travel Time Method, which finds the time of concentration through the combination of the travel time for sheet flow, shallow concentrated flow and open channel flow. The watershed parameters of area, average slope, hydraulic length, and Manning's roughness coefficient were input into HydroCAD for each sub-basin. The rainfall data for the 2-yr, 25-yr, and 100-yr 24-hour storm events were also input into HydroCAD as type II rainfall hyetographs.
After building the model for each sub-watershed, the hydrograph was run in each basin to provide peak flows and the time elapsed to the these peak flows. Lag times for each reach were calculated using the Curve Number method. These values were added to the translated runoff flow rates for each time period in order to obtain the flow rate at each junction. |
Excel - Rational Method
|
The Rational equation is the simplest method to determine peak discharge from drainage basin runoff. Although it is the most common method to use for sizing sewer system, it is less sophisticated as HEC-HMS and Hydro-CAD model.
The discharge rate for each sub-basin was calculated using Microsoft Excel software and the flow rate equation Q = C×i×A to estimate the runoff. A runoff coefficient (C) was assumed to be 0.30 as the surrounding soil of Door Creek consists of a mixture of clay and silt loam. The rainfall intensity (i) was found by checking the precipitation data under certain return period with log interpolation in NOAA. |
Approach 2 - Channel Morphology Delineation in ArcMap

|
|


Approach 3 - Inundation Map Generation Using HEC-RAS


|
To generate an inundation map, results from previous steps were applied as input: The edited topography and morphology data was imported into HEC-RAS as geometry data; Discharge values from hydrological models were treated as initial conditions; Downstream water elevation was input as the boundary condition. The cross-section, shown on the left side, was linearly interpolated to enhance resolution of the model to finer match the actual channel. After setting up all conditions mentioned above, we ran HEC-RAS model under sub-critical condition to obtain the result including water elevation and channel profiles.
Then, we exported all results from HEC-RAS back into HEC-GEORAS. Based on the different water elevation under varied discharge conditions, a series of inundation maps were generated.
|

|

|
